ComScore today released the results of its monthly rolling survey of U.S. mobile phone users for the October-December 2013 period, showing that Apple's U.S. smartphone market share has increased 1.2 percentage points since September, for a total share of 41.8 percent. Though Apple's share continues to grow, it still lags behind Android's total share of 51.5 percent, down 0.3 percent since September.
Looking at handset manufacturers, Apple and Samsung continue to dominate the category, growing their control of the market by 1.2 percent each over the three month period. Motorola, LG and HTC round out the top five, with all of them seeing flat or negative growth.
In Apple's earnings call last month, CEO Tim Cook warned that U.S. iPhone sales were weaker than expected because of U.S. carriers changing their upgrade policies. As a result, seeing share growth despite the headwinds is a positive sign for the company.

156 million people in the U.S. owned smartphones (65.2 percent mobile market penetration) during the three months ending in December, up 3.2 percent since September. Apple ranked as the top OEM with 41.8 percent of U.S. smartphone subscribers (up 1.2 percentage points from September). Samsung ranked second with 26.1 percent market share (up 1.2 percentage points), followed by Motorola with 6.7 percent, LG with 6.6 percent and HTC with 5.7 percent.
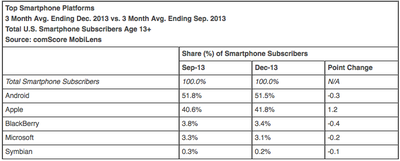
Apple grew its smartphone market share by 0.6 percent from November, largely at the expense of Android and BlackBerry. Despite a significant marketing effort, Micrsoft's Windows Mobile has failed to gain any traction over the past three months, dropping 0.2 percent from 3.3% to 3.1% of total platform share.
ComScore's data tracks installed user base rather than new handset sales, which means it is more reflective of real-world usage but slower to respond to shifting market trends than some other studies.