With the Activity Monitor app in macOS, you can force quit misbehaving apps, find out how much energy your Mac is using, and see which apps or processes are eating the most processor cycles. If you're on a portable Mac and you have suspicions that an app is sapping your battery, Activity Monitor can help you identify it. This article explains how to use it.
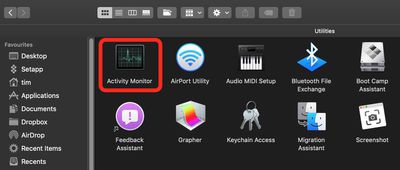
You can find the Activity Monitor on your Mac in the /Applications/Utilities folder. The main window lists all the apps and processes currently running on your Mac. You'll notice the order jumps around a lot. That's because you're seeing the list being updated every five seconds to show changes in individual app usage statistics.
You can click the triangle next to an app's name to display all the child processes under the parent application. To display more columns, select View -> Columns in the menu bar, then choose the columns you want to view. Note that the columns available to you will depend on whether you're using a desktop or a notebook Mac.
How to Quit an App in Activity Monitor
If you're having issues with a particular app or process (if it's frozen/unresponsive, for example) Activity Monitor allows you to kill it. Keep reading to learn how it's done.
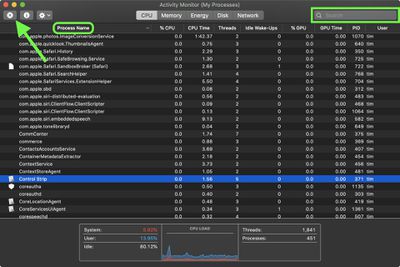
- Under the Process Name list, select the app or process you want to quit. To make finding the culprit easier, click Process Name in the column header to sort them alphabetically, or use the Search field in the top-right corner of the window to find the app or process. Note that an unresponsive process is labelled with (Not Responding).

- Make sure the app or process is highlighted, then click the Quit (X) button in the top-left corner of the Activity Monitor window.
- Select Quit (this is the same as choosing File -> Quit within an app) or Force Quit, which quits the process immediately.
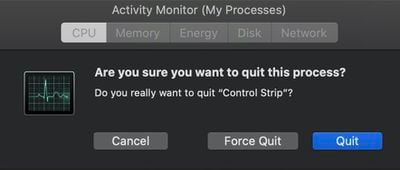
Note that if the app or process has files open, force quitting it may cause you to lose data. Also, bear in mind that if the process you force quit is used by other apps or processes, those apps or processes may experience issues.
Now, let's take a closer look at the five tabs at the top of the Activity Monitor window.
The CPU Tab
The CPU tab gives you an overview of how processes are using your Mac's processor. From this list view, you can find out what percentage of the CPU a process is taking up, how long it's been active, the name of the user or service that is running the process, and more.
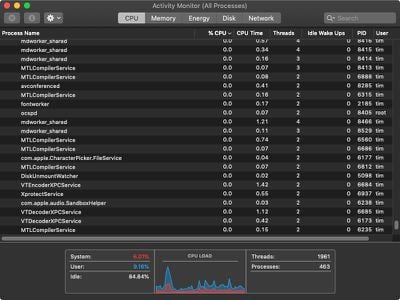
Below the list are system-wide statistics, including the percentage of your CPU that system-level processes and apps/processes you opened are using. The CPU Load graph displays a timeline of total processor load, with red indicating system processes and blue for user processes.
If an app or process looks like it's taking up more CPU load than it should (when it's supposed to be idle, for example) and slowing down your Mac, you can always kill it using the same steps outlined above. Be careful when force quitting processes that you don't recognize, as they may be supporting important background services, such as regulating your Mac's temperature, for example.
The Memory Tab
If you want to know how your Mac's RAM is being used, this is the tab to click. When your computer approaches its maximum memory capacity, inactive apps in memory are compressed, making more memory available to active apps. Check the Compressed Mem column for each app to see the amount of memory being compressed for that app.
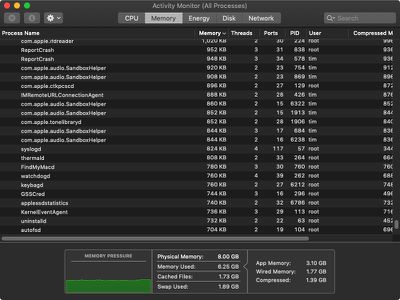
Like all the tabs in Activity Monitor, you can find global statistics at the bottom window. The Memory Pressure graph represents how efficiently your memory is serving your processing needs. Memory pressure is determined by the amount of free memory, swap rate, wired memory (data that can't be compressed or swapped to your hard disk) and file cached memory.
To the right of the graph you'll see your Mac's total physical memory, how much of it is being used, how much is taken up by cached files (files cached by the system into unused memory to improve performance), and the amount of space being used on your startup disk to swap unused files to and from RAM.
The Energy Tab
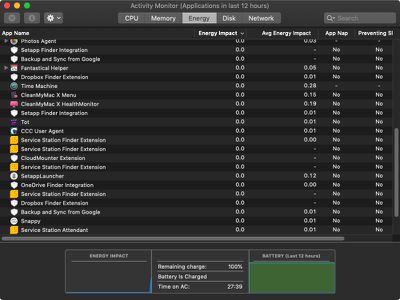
Using the Energy tab, you can find out how much energy your Mac is using and see which apps or processes are eating the most processor cycles. If you're on a portable Mac and you have suspicions that an app is sapping your battery, the Energy tab can help you identify it.
The following descriptions explain what each column tells you.
- Energy Impact: Gives a relative measure of the current energy consumption of each app (lower is better).
- Average Energy Impact: Which apps use the most energy over time.
- App Nap: Tells you if App Nap is active for each app. App Nap is an energy feature that causes inactive background applications to go into a paused state, helping to reduce power usage.
- Requires High Perf GPU: Indicates whether the app is using your Mac's discrete graphics card (if it has one).
- Preventing Sleep: Shows if an app is preventing your Mac from entering Sleep mode.
Below the list you'll see information on your overall energy use. If you have a portable Mac, you'll also see information related to battery usage. This can include the following:
- Remaining charge: The percentage of battery remaining.
- Time until full (plugged in): The amount of time your Mac must be plugged into an AC power point until the battery is fully charged.
- Time on AC (plugged in): The time that has elapsed since your Mac was plugged into an AC power point.
- Time remaining (unplugged): The estimated amount of battery time remaining.
- Time on battery (unplugged): How long it's been since your Mac was plugged into an AC power point.
- Battery (Last 12 hours): The battery charge level over the last 12 hours.
Tip: If you're on a portable Mac and you're not getting great battery life, check the apps at the top of the Average Energy Impact column and consider quitting these apps if you don't need them.
If you want more fine-grained control over an app (a web browser with extensions, for example) then use the triangles next to apps to see which child processes have the highest energy impact on your Mac. That way you can quit them individually.
The Disk Tab
This tab tracks the number of times your Mac accesses the disk to read and write data, known as "reads in" and "reads out" (IO). You can switch the graph at the bottom of the window to show IO or data as a unit of measurement. The blue line shows data read or number of reads, while red shows data written or number of writes.
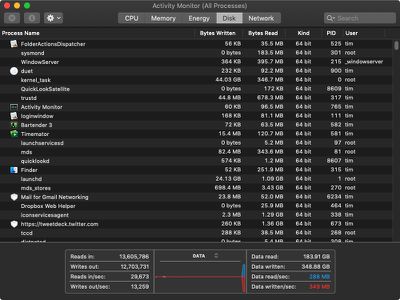
To the right of the graph, the associated "Data read/sec" and "Data written/sec" numbers are useful for ascertaining overall disk usage. If disk usage is high, this could indicate that your Mac's working RAM is low and that your disk is being used as "virtual memory," swapping data back and forth to compensate for the lack of physical memory.
The Network Tab
Here you can find out how much data your Mac is sending and receiving over your local network and the internet. The information at the bottom of the window displays network usage in packets and the amount of data sent and received. The chevrons next to the title in the graph can be used to switch between the two types of readings.
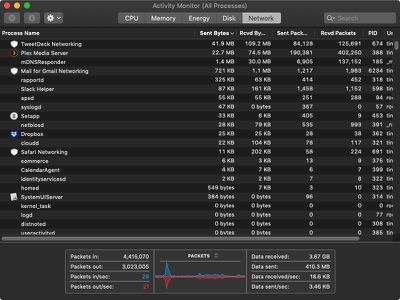
There are hundreds of background processes that make up a Mac's normal network activity that likely won't make sense to the average user. The good news is that even if you don't recognize a process, it's almost definitely benign and doing some sort of work for the system. Still, it's good to know that if you ever learn about a suspect process communicating in the background, you can identify it from here.
If you're still curious about which apps are sending and receiving data in the background, you may find some additional comfort in the third-party app Little Snitch, which monitors network traffic in real time and alerts you to it.
Final Tip
You can keep an eye on your system status without even looking at the Activity Monitor window.
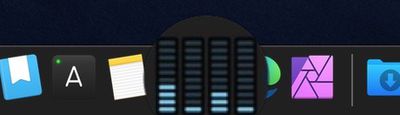
To monitor your CPU, network or disk usage as a live graph right in the Dock, choose View -> Dock Icon -> Show Disk Activity from the menu bar, select the preferred tab in the Activity Monitor window, then minimize the app.