iOS 7.1 Adoption at 6% 24 Hours After Release
Though it was only released yesterday morning, iOS 7.1 has already been installed on 5.9 percent of iOS devices in North America, according to a new report from analytics firm Chitika. To get its numbers, Chitika measured ad impressions from tens of millions of iOS-based devices in the U.S. and Canada from March 9 to March 11, 2014.
The adoption rates are similar to those of iOS 7.0.6, which offered a critical security fix and was installed on 13.3 percent of iOS devices 48 hours after release and 25 percent of devices after four days.
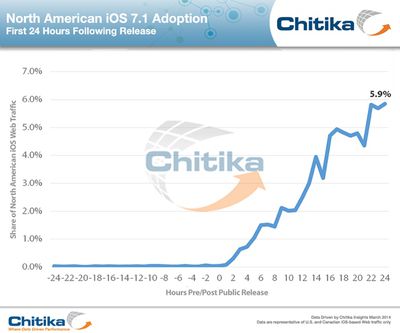
As with most minor version updates, iOS 7.1 adoption rates have been less dramatic than those of its major-version counterparts. In the 24 hours following the operating system's public release, iOS 7.1 users generated 5.9% of total North American iOS Web traffic.
iOS 7.1 offers CarPlay support, Touch ID improvements, bug fixes, and several visual tweaks for iOS, including revamped shift and caps locks keys for the keyboard, refined icons for the Phone, FaceTime, and Messages apps, and a redesign for several aspects of the Phone dialer and shutdown screen.
Beyond iOS 7.1, iOS 7 users generated more than 80 percent of all iOS web traffic over the three days Chitika measured, a number that has remained steady since the company's previous February 26 study.
Chitika's overall iOS 7 usage numbers in North America are in line with reports from Apple's App Store support page for developers, which indicates 83 percent of all iOS devices have iOS 7 installed as of March 9, 2014.
Popular Stories
Apple hasn't updated the AirPods Pro since 2022, and the earbuds are due for a refresh. We're counting on a new model this year, and we've seen several hints of new AirPods tucked away in Apple's code. Rumors suggest that Apple has some exciting new features planned that will make it worthwhile to upgrade to the latest model.
Subscribe to the MacRumors YouTube channel for more videos.
Heal...
Chase this week announced a series of new perks for its premium Sapphire Reserve credit card, and one of them is for a pair of Apple services.
Specifically, the credit card now offers complimentary annual subscriptions to Apple TV+ and Apple Music, a value of up to $250 per year.
If you are already paying for Apple TV+ and/or Apple Music directly through Apple, those subscriptions will...
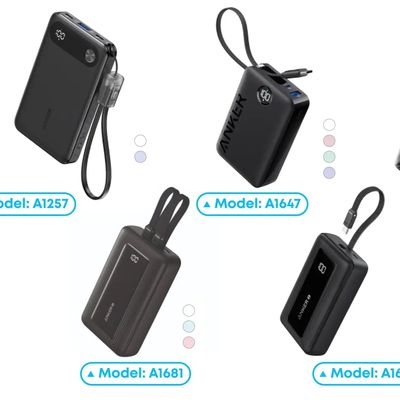
Popular accessory maker Anker this month launched two separate recalls for its power banks, some of which may be a fire risk.
The first recall affects Anker PowerCore 10000 Power Banks sold between June 1, 2016 and December 31, 2022 in the United States. Anker says that these power banks have a "potential issue" with the battery inside, which can lead to overheating, melting of plastic...
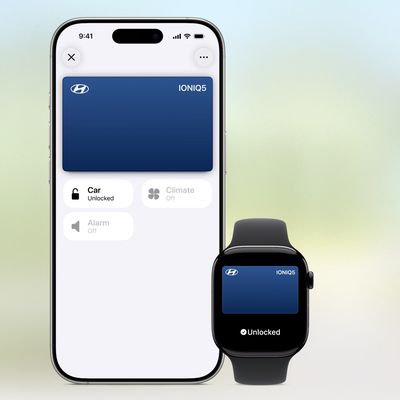
In 2020, Apple added a digital car key feature to its Wallet app, allowing users to lock, unlock, and start a compatible vehicle with an iPhone or Apple Watch. The feature is currently offered by select automakers, including Audi, BMW, Hyundai, Kia, Genesis, Mercedes-Benz, Volvo, and a handful of others, and it is set to expand further.
During its WWDC 2025 keynote, Apple said that 13...
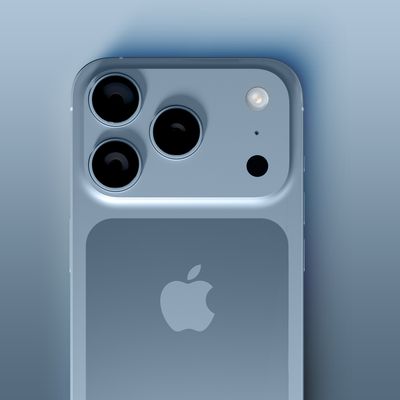
Apple's next-generation iPhone 17 Pro and iPhone 17 Pro Max are around three months away, and there are plenty of rumors about the devices.
Apple is expected to launch the iPhone 17, iPhone 17 Air, iPhone 17 Pro, and iPhone 17 Pro Max in September this year.
Below, we recap key changes rumored for the iPhone 17 Pro models:Aluminum frame: iPhone 17 Pro models are rumored to have an...
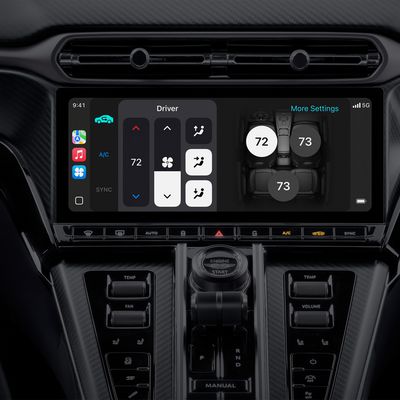
Apple last month announced the launch of CarPlay Ultra, the long-awaited next-generation version of its CarPlay software system for vehicles.
There was news this week about which automakers will and won't offer CarPlay Ultra, and we have provided an updated list below.
CarPlay Ultra is currently limited to newer Aston Martin vehicles in the U.S. and Canada. Fortunately, if you cannot...
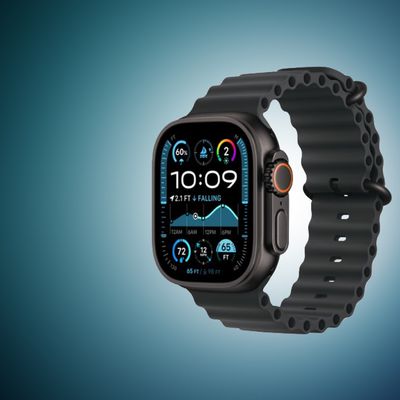
Apple will finally deliver the Apple Watch Ultra 3 sometime this year, according to analyst Jeff Pu of GF Securities Hong Kong (via @jukanlosreve).
The analyst expects both the Apple Watch Series 11 and Apple Watch Ultra 3 to arrive this year (likely alongside the new iPhone 17 lineup, if previous launches are anything to go by), according to his latest product roadmap shared with...
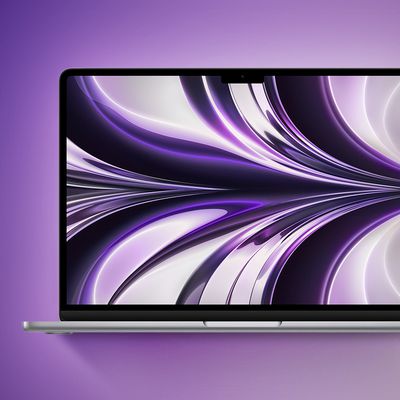
Apple is planning to launch a low-cost MacBook powered by an iPhone chip, according to Apple analyst Ming-Chi Kuo.
In an article published on X, Kuo explained that the device will feature a 13-inch display and the A18 Pro chip, making it the first Mac powered by an iPhone chip. The A18 Pro chip debuted in the iPhone 16 Pro last year. To date, all Apple silicon Macs have contained M-series...
Apple is developing a MacBook with the A18 Pro chip, according to findings in backend code uncovered by MacRumors.
Earlier today, Apple analyst Ming-Chi Kuo reported that Apple is planning to launch a low-cost MacBook powered by an iPhone chip. The machine is expected to feature a 13-inch display, the A18 Pro chip, and color options that include silver, blue, pink, and yellow.
MacRumors...